Note
Click here to download the full example code
Set the region argument
Many of the plotting functions take an argument for the region argument, which sets
the area that will be shown in the figure. This tutorial covers the different types of
inputs that it can accept.
import pygmt
Coordinates
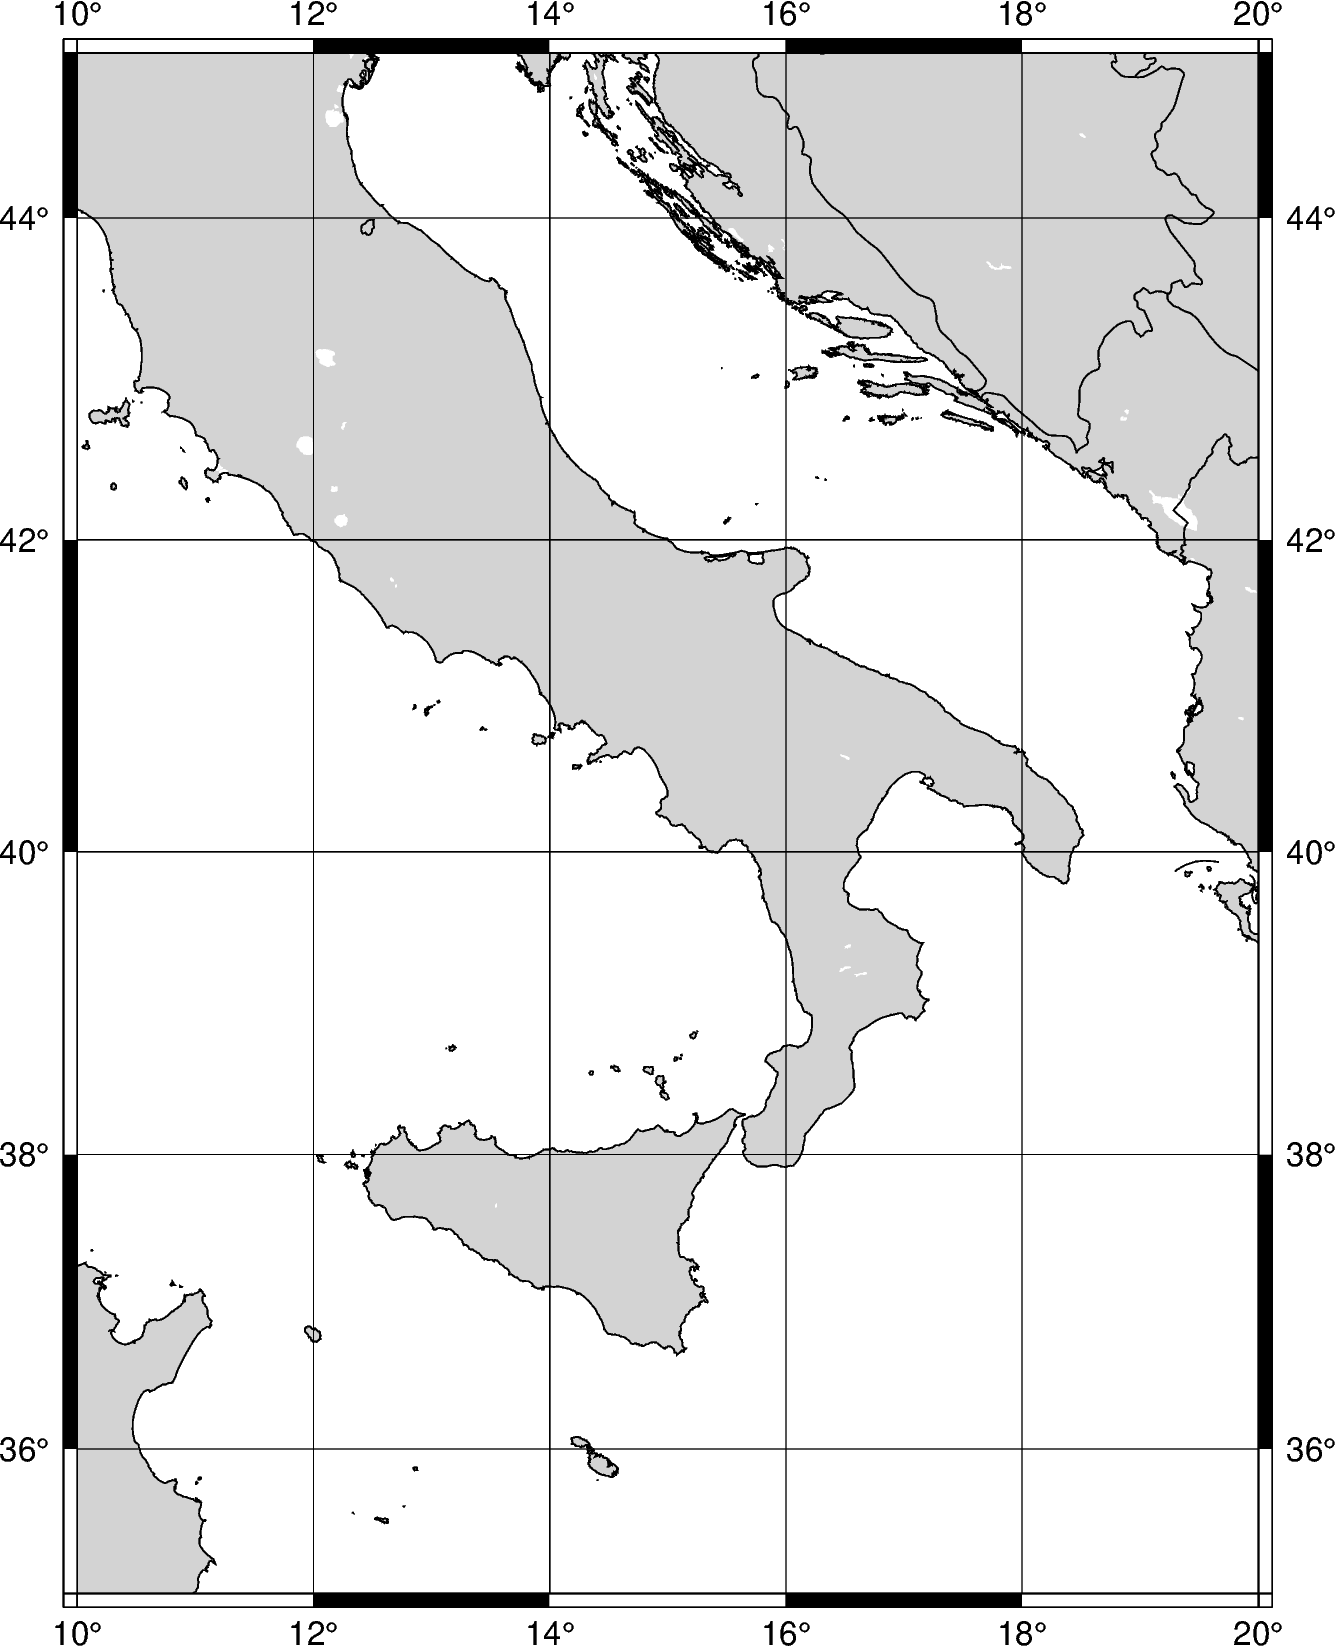
A string of coordinates can be passed to region, in the form of
xmin/xmax/ymin/ymax.
fig = pygmt.Figure()
fig.coast(
    # Sets the x-range from 10E to 20E and the y-range to 35N to 45N
    region="10/20/35/45",
    # Set projection to Mercator, and the figure size to 15 centimeters
    projection="M15c",
    # Set the color of the land to light gray
    land="lightgray",
    # Set the color of the water to white
    water="white",
    # Display the national borders and set the pen-size to 0.5p
    borders="1/0.5p",
    # Display the shorelines and set the pen-size to 0.5p
    shorelines="1/0.5p",
    # Set the frame to automatic and display gridlines
    frame="ag",
)
fig.show()
Out:
<IPython.core.display.Image object>
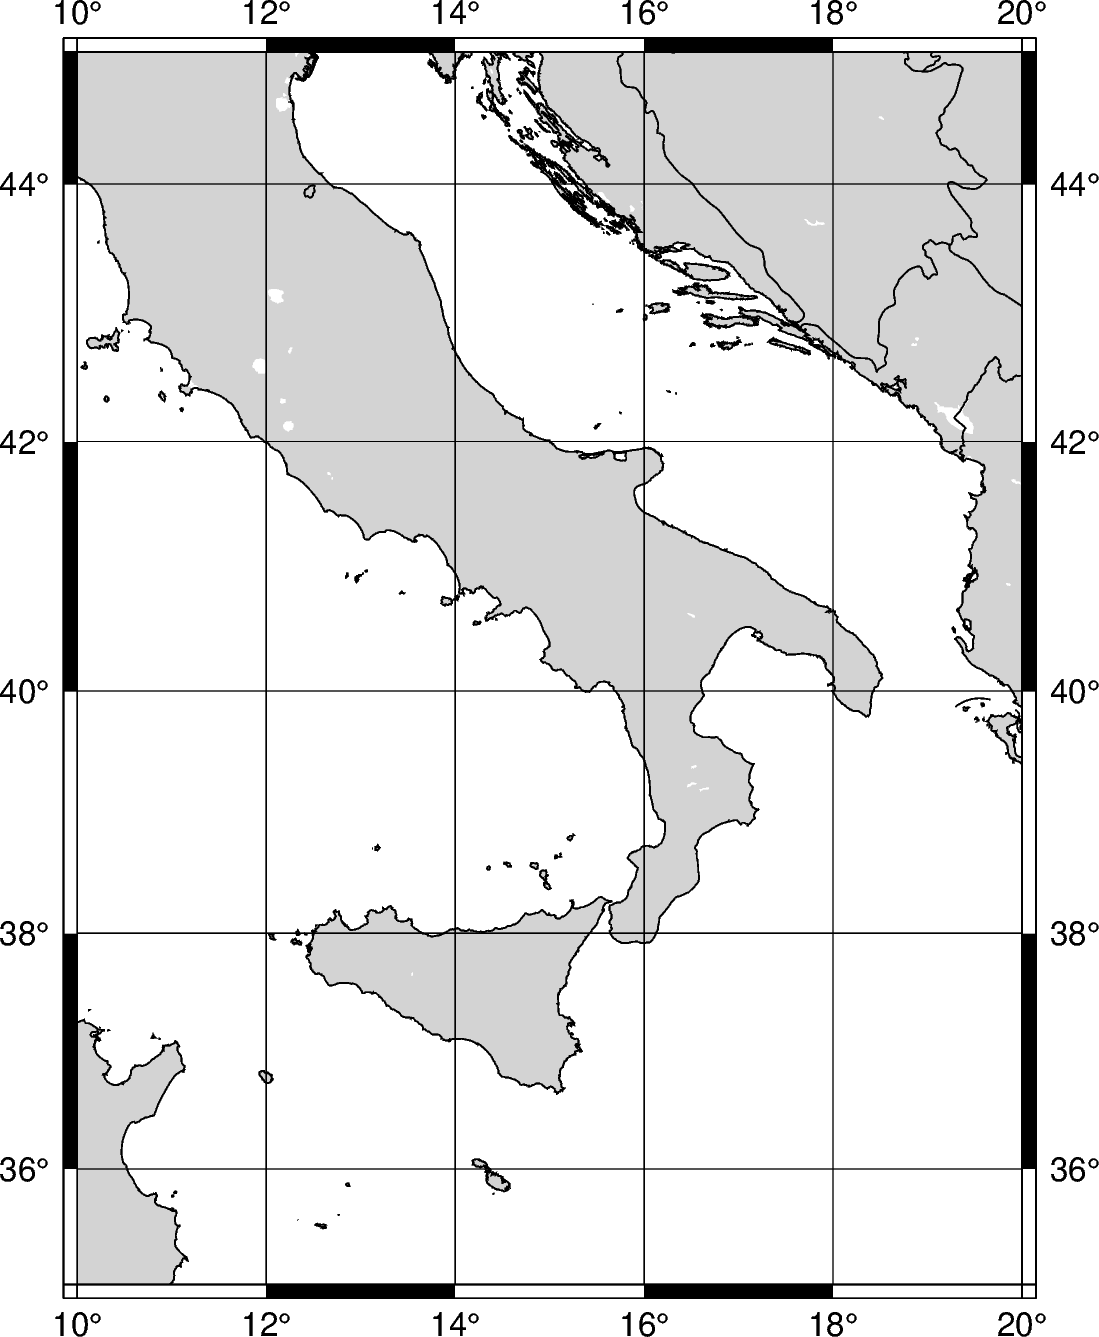
- The coordinates coordinates can be passed to
regionas a list, in the form of [xmin,*xmax*,*ymin*,*ymax*].
fig = pygmt.Figure()
fig.coast(
    # Sets the x-range from 10E to 20E and the y-range to 35N to 45N
    region=[10, 20, 35, 45],
    projection="M12c",
    land="lightgray",
    water="white",
    borders="1/0.5p",
    shorelines="1/0.5p",
    frame="ag",
)
fig.show()
Out:
<IPython.core.display.Image object>
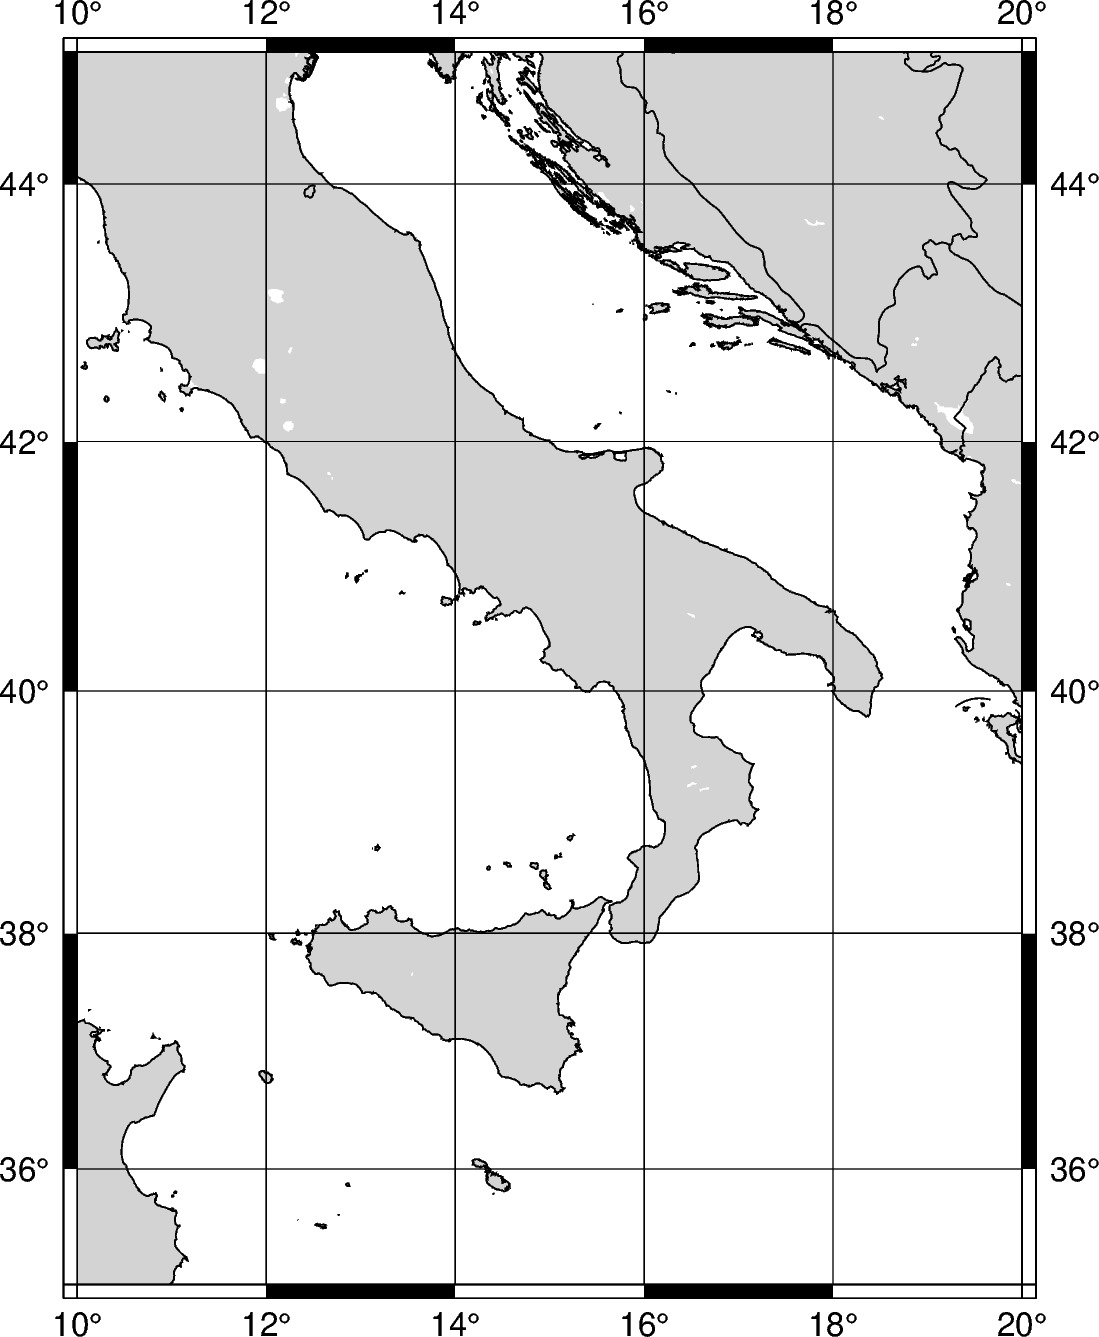
GMT has the option for region coordinates to be passed in classic mode, which was the
standard prior to GMT version 6. The string format takes the coordinates for the
bottom-left and top-right coordinates. To specify classic mode, append +r at the
end of the region string.
fig = pygmt.Figure()
fig.coast(
    # Sets the bottom-left corner as 10E, 35N and the top-right corner as 20E, 45N
    region="10/35/20/45+r",
    projection="M12c",
    land="lightgray",
    water="white",
    borders="1/0.5p",
    shorelines="1/0.5p",
    frame="ag",
)
fig.show()
Out:
<IPython.core.display.Image object>
Global regions
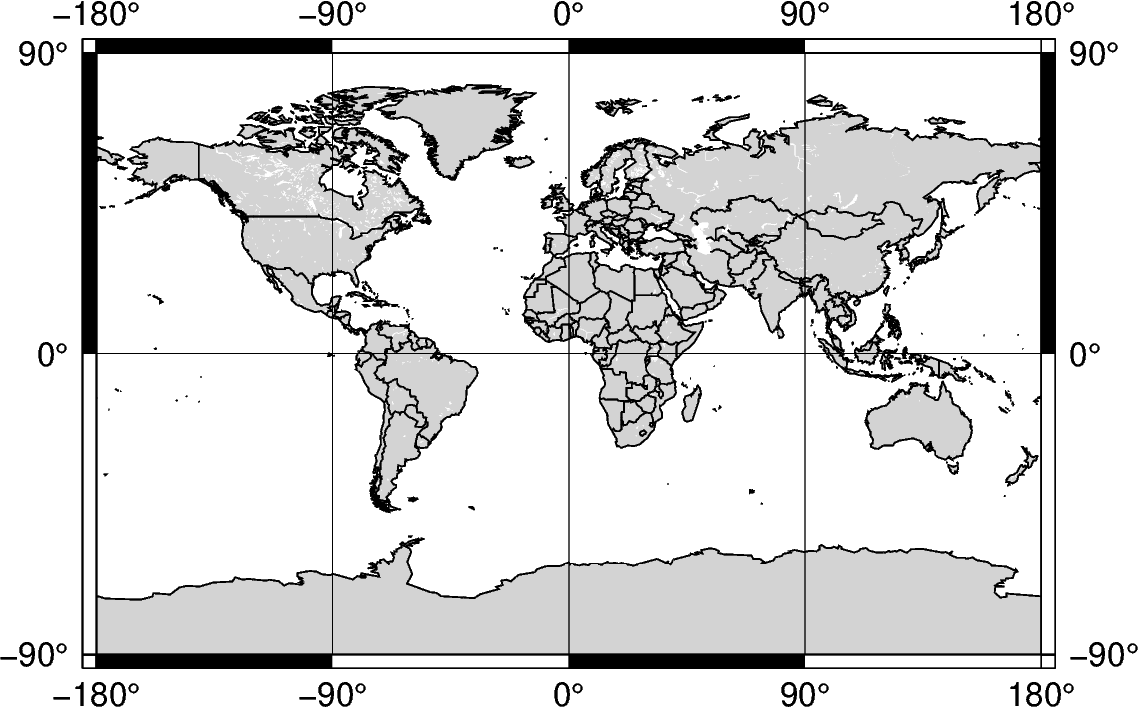
In addition to passing coordinates, the argument d can be passed to set the region to the entire globe. The range is 180W to 180E (-180, 180) and 90S to 90N (-90 to 90). With no parameters set for the projection, the figure defaults to be centered at the mid-point of both x- and y-axes. Using d, the figure is centered at 0,0, or the intersection of the equator and prime meridian.
fig = pygmt.Figure()
fig.coast(
    region="d",
    projection="Cyl_stere/12c",
    land="lightgray",
    water="white",
    borders="1/0.5p",
    shorelines="1/0.5p",
    frame="ag",
)
fig.show()
Out:
<IPython.core.display.Image object>
The argument g can be passed, which encompasses the entire globe. The range is 0E to 360E (0, 360) and 90S to 90N (-90 to 90). With no parameters set for the projection, the figure is centered at 180,0, or the intersection of the equator and International Date Line.
fig = pygmt.Figure()
fig.coast(
    region="g",
    projection="Cyl_stere/12c",
    land="lightgray",
    water="white",
    borders="1/0.5p",
    shorelines="1/0.5p",
    frame="ag",
)
fig.show()
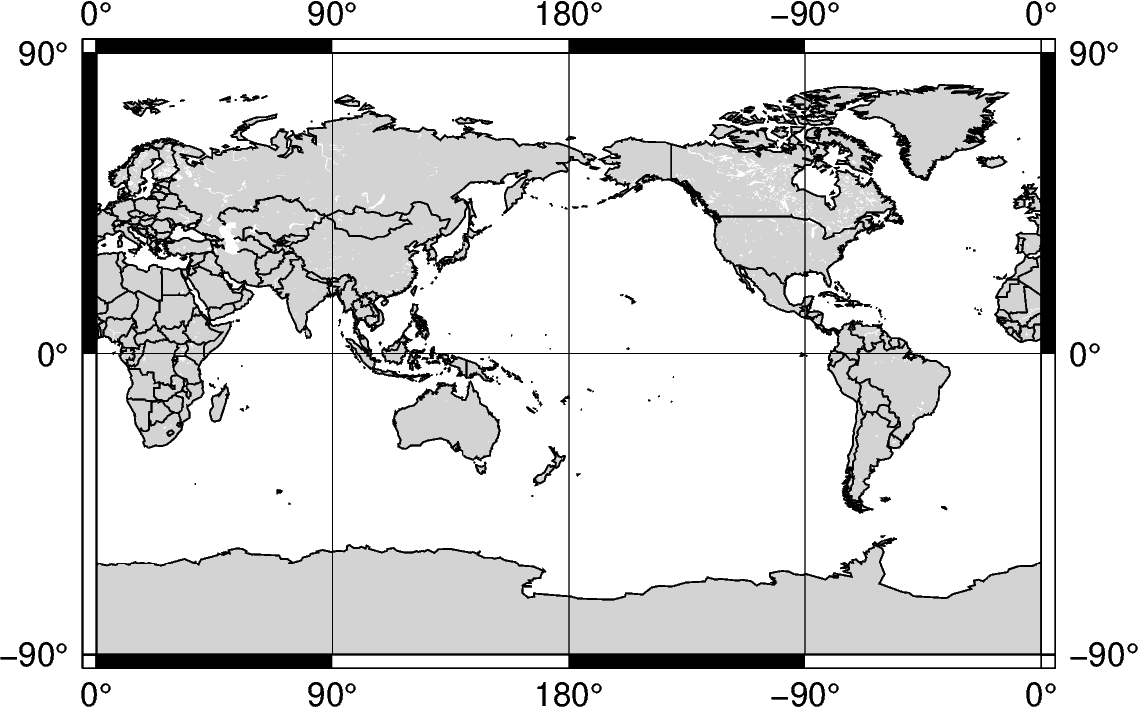
Out:
<IPython.core.display.Image object>
Total running time of the script: ( 0 minutes 4.068 seconds)